@ShahidNShah


April 19, 2023
Online
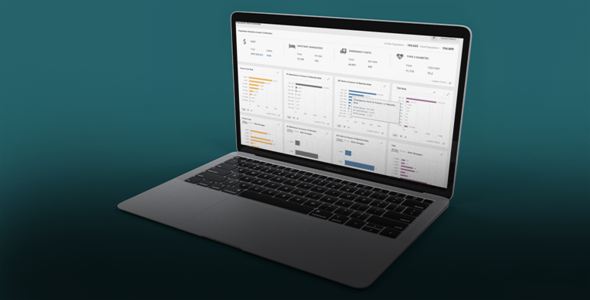
Data-driven healthcare organizations continue to leverage Microsoft Excel because of its accessibility, flexibility, and advanced analytical and computing features. In trained hands, Excel can serve as an all-purpose tool for data analytics and produce remarkably visual and adaptable reporting for leadership. In this webinar, we’ll share 4 proven design techniques you can implement in Excel to build highly effective visualizations that communicate metrics healthcare leadership teams can use to drive better performance. We’ll discuss ways to strategically integrate data and graphics to publish sophisticated visual analytics in Excel. You’ll walk away with fresh design ideas that can breathe new life into your existing Excel projects and transform your current charts and reports into modern-day visualizations that rival those created with more complicated and costly tools such as Microsoft PowerBI and Tableau.
Continue reading at us06web.zoom.us
April 19 to April 20, 2023
Paris, France
Connecting innovation decision makers to authoritative information, institutions, people and insights.
Medigy accurately delivers healthcare and technology information, news and insight from around the world.
Medigy surfaces the world's best crowdsourced health tech offerings with social interactions and peer reviews.
© 2025 Netspective Foundation, Inc. All Rights Reserved.
Built on Apr 17, 2025 at 6:07am